
A route business can look great on paper and still wear you out in real life. That’s the trap. Revenue can be solid, the trucks can look clean, and the seller can sound confident, but if the customers are scattered all over creation, your margins can leak every single day.
If you’re buying in Georgia or South Carolina, service route density is your primary defense against those leaking margins. Measuring route density early, not last, lets you see the business more clearly before you sign anything.
Key Takeaways
- Route density is your best defense against leaking margins in service businesses like lawn care, pest control, or janitorial – it measures how tightly customers cluster to minimize drive time, fuel, and labor waste.
- Map 12 months of actual job locations using Google My Maps or route software before buying; seller stories hide the confetti patterns that turn profitable revenue into tiring days.
- Focus on key metrics like stops per mile, revenue per mile, and drive time as a share of paid time – they expose true efficiency, especially in GA/SC spots like Atlanta traffic or Hilton Head bridges.
- Dense routes justify premium pricing and smooth scaling; thin ones demand lower offers, seller holdbacks, or growth plans like clover leafing to build clusters.
- Don’t chase shiny revenue or buildings first – price the space between customers honestly for cleaner deals in Savannah, Macon, Pooler, and beyond.
Why route density matters more than a pretty revenue number
Route density is simple. How tightly packed are the customers, and how much money can the team earn between stops?
Think of it like a fishing net. A tight net catches more with less effort. A wide, ragged net burns travel time, fuel costs, labor costs, and patience. That’s what sparse routing does to a service business.
This matters in the lawn care industry, pest control, pool service, plumbing, HVAC, janitorial, and mobile pet services. Two companies can each post $1 million in annual sales. One may run tight routes in Savannah, Pooler, and nearby neighborhoods. The other may bounce from Macon to Warner Robins, then out toward Dublin, with long gaps between jobs across a sprawling territory. Same revenue, very different day.
When you’re browsing Georgia businesses for sale, it is easy to get pulled in by recurring revenue, long customer history, or a sharp-looking fleet. That’s fine. Those things matter. But a route-based company lives or dies in the windshield time between appointments.
A Business For Sale teaser rarely tells you that Tech A spends 2.5 hours a day driving or that half the route crosses congested corridors at the worst possible time. It may not tell you that one “service area” is really three separate pockets with nothing in between.
If you don’t know where the customers sit, you don’t know what you’re buying.
That’s why route density isn’t a side note. It’s one of the clearest ways to judge how efficient, scalable, and buyer-friendly the business really is, especially for long-term profitability.
Start with a map, not the seller’s story
Before you trust any route business, plot the work on a map. Not a vague service area map. The real one.
Ask for 12 months of completed jobs by service address, or at least by ZIP code and service frequency. Strip out customer names if privacy is a concern. What you need is location, ticket size, and how often each stop repeats.
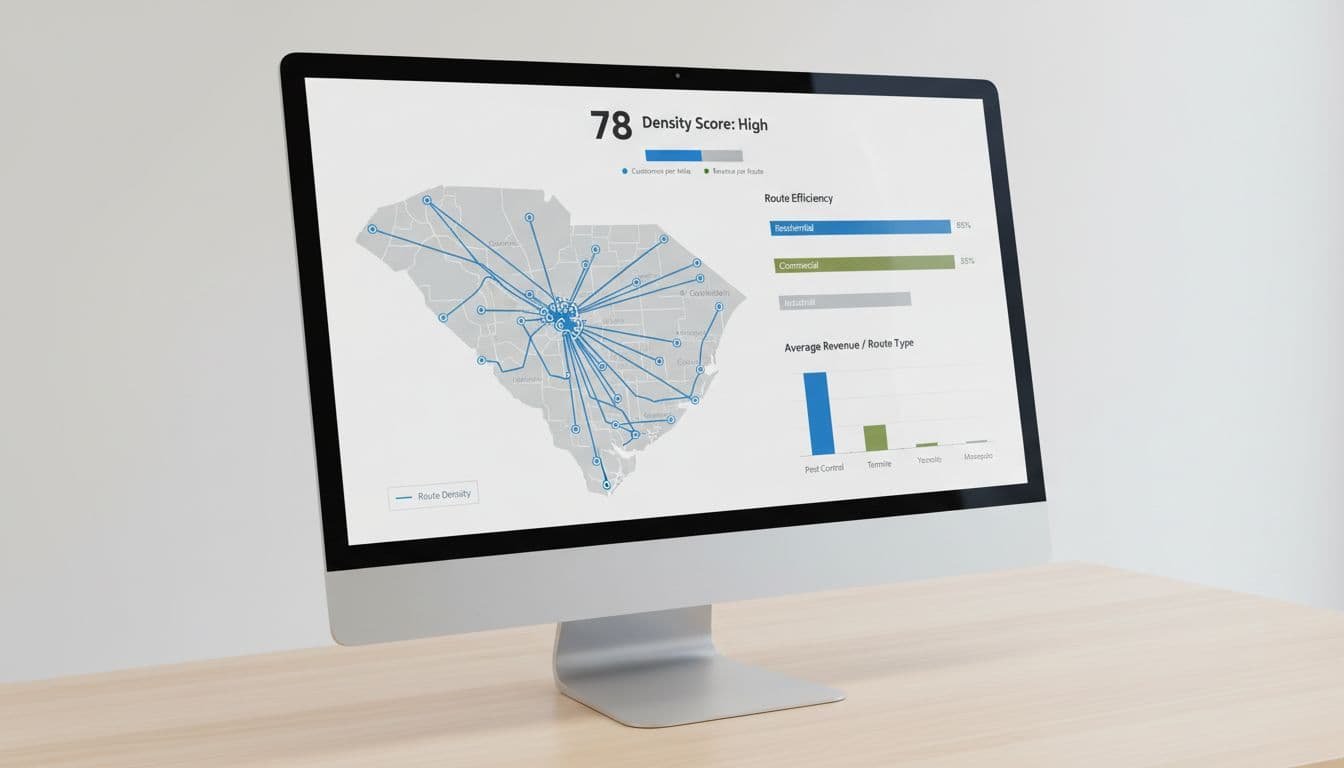
Then map it. Google My Maps works. Route optimization software works too for analyzing the geographic area. Route-planning tools work. Even a spreadsheet with coordinates can tell a story fast. When the data hits the map, weak spots stop hiding. Analyzing the distance between stops reveals the true operational efficiency of the business.
A healthy pattern often looks like concentrated service stops around logical operating zones. Maybe one cluster sits around Savannah and Pooler, another near Brunswick, and a smaller premium route sits around Hilton Head. A messy pattern looks like confetti, little pockets with dead space between them.
This is where buyers often learn the difference between a good business and a tiring one. The seller may say, “We cover all of coastal Georgia.” Okay. But should you? Broad territory sounds impressive until you have to staff it.
For recurring cleaning or facility accounts, the same rule applies. That’s one reason route quality matters so much when buying a janitorial business in Georgia and South Carolina. Dense recurring work creates smoother days and easier scheduling. Thin routing turns every small cancellation into lost money.
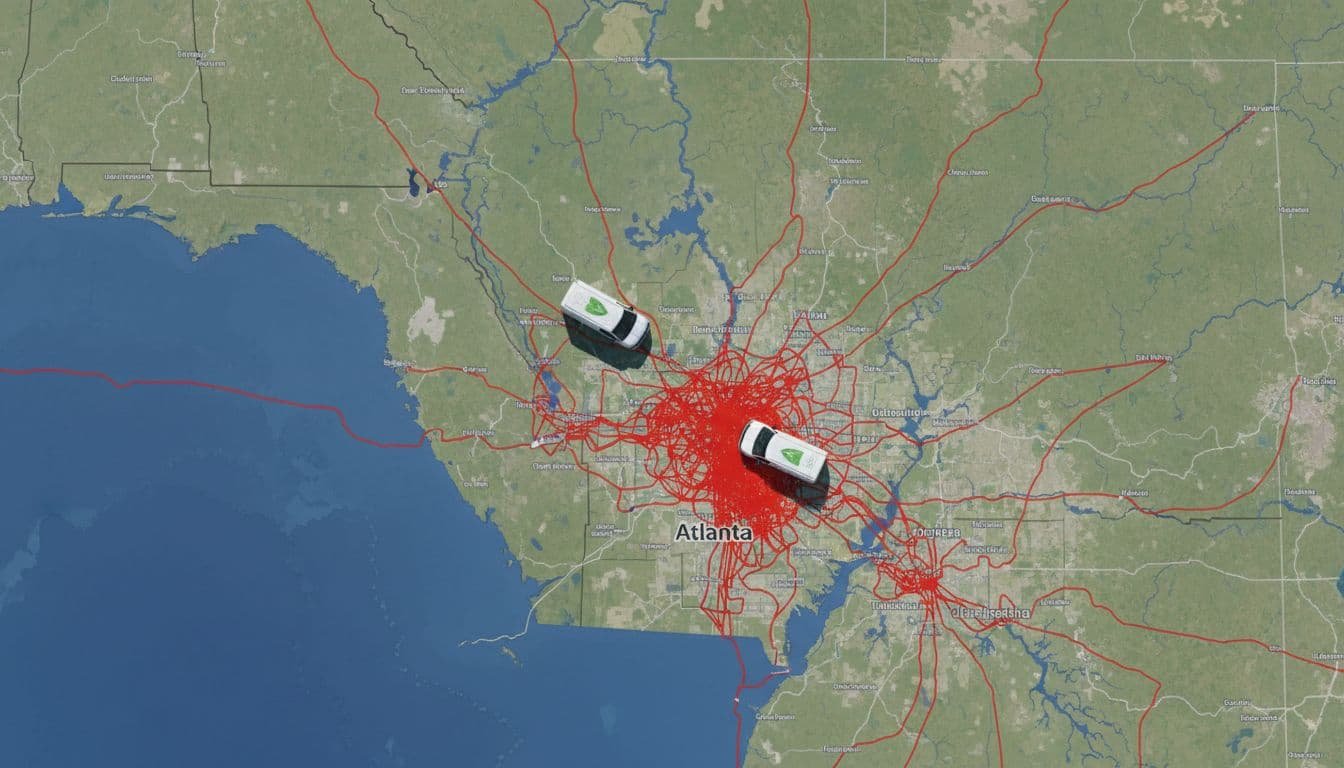
Watch for local friction points too. Bridge traffic around Hilton Head and Savannah can chew up an hour fast. Atlanta routes may be denser, but density without traffic context can fool you. A tight-looking map can still be a slow-moving day.
The numbers that tell you if a route is tight or messy
A map shows the shape. The metrics tell you if the shape makes money.
You don’t need a fancy model to start. You need honest operating data. Pull dispatch logs, invoices, GPS reports if available, payroll hours, fuel spend, and average billable work. Then calculate a few measurements that make the route business feel real.
This quick table gives you the core checks.
| Metric | What it shows | What to watch for |
|---|---|---|
| Customers per route day | How many stops a tech completes in a normal day | Low stop count with long paid hours |
| Revenue per stop | Whether each visit is worth the travel | Small tickets spread across a wide area |
| Revenue per mile | How much sales volume the route creates for every mile driven | Long mileage without matching ticket size, plus higher fuel and vehicle maintenance costs |
| Drive time as a share of paid time | How much labor is spent in the truck instead of on the job | Anything trending too high for the service type |
| Repeat density by ZIP or neighborhood | Whether recurring clients cluster together | One-off jobs mixed into premium recurring zones |
| Cost per stop | The true expense of serving each customer | High costs driven by scattered locations |
| Stops per mile | Density of service calls along the route | Low density signaling inefficiency |
| Stops per hour | Technician efficiency in covering ground and jobs | Low numbers indicating excess drive time |
These metrics reveal the unit economics of the route and show if it’s truly profitable at a granular level. Stops per mile and revenue per route hour usually tell the truth faster than total revenue does.
A pest route in South Carolina may perform beautifully with a lower stop count if tickets are higher and neighborhoods sit close together. A low-ticket route in Waycross or Dublin needs tighter clustering to work. In Atlanta, the challenge may not be mileage at all. It may be time trapped in traffic.
Don’t let averages hide the mess, either. Look at best days and worst days. If Monday prints money and Thursday looks like a scavenger hunt, the route needs work. Strong service route density should hold up across the week, not only when the schedule is perfect.
Georgia and South Carolina don’t reward density the same way
This part matters more than buyers think. Route density is local, and regional challenges tie directly into scheduling and logistics.
Savannah and Pooler territory often rewards neighborhood clustering, HOA work, and repeat residential service. Hilton Head can support strong pricing, but gated communities, seasonal swings, and bridge traffic change how you measure a “tight” route. Brunswick can be solid if the work stays concentrated. Spread it too far toward smaller coastal pockets, and the day starts leaking.
Atlanta is its own animal. You may have plenty of customers packed into a smaller radius, but timing becomes part of the density equation. Ten miles in metro Atlanta can cost more time than twenty miles near Macon, impacting on-time arrival and tight delivery windows. That’s why map distance alone doesn’t settle the question. Modern buyers should look for businesses utilizing dynamic routing to handle these local friction points.
Macon and Warner Robins territory usually rewards clean, practical routing. Buyers there should pay attention to military-related demand, suburban growth, and how easily a tech can move between jobs without crossing the whole market. Dublin and Waycross need even more discipline. Those smaller trade areas can still produce good route businesses, but the pricing, retention, and repeat work have to support the travel.
Then there’s the real estate piece. Some Businesses for Sale include a shop, warehouse, or yard. Others are home-based or run out of rented space. CRE matters, but it shouldn’t distract you from the route itself. A shiny building won’t fix weak routes.
If a deal includes commercial real estate listings in Georgia and South Carolina, ask how the property helps routing. Is it near the customers? Does it shorten morning dispatch? Does it support storage, loading, or technician parking? You’ll also see listings described as Commercial Real Estate for sale, CRE for Lease, or Commercial Real Estate for Lease. That’s useful information, but the route still has to work.
Turn route density into price, terms, and site decisions
Once you know the route quality, use it. This is where buyers either protect themselves or overpay.
Start with the route map and ask four hard questions:
- If I owned this tomorrow, would I keep the current territory exactly as is?
- How much payroll is tied up in drive time that customers never see?
- Which accounts are true anchors, the ones that make nearby stops more profitable?
- What happens if I lose the owner’s personal scheduling magic?
If the route is dense and repeatable, you may have a premium asset that generates more referrals from neighbors who see the trucks frequently. If it’s thin, your offer should reflect the cleanup work ahead, but view it as a growth opportunity. A new marketing strategy using door hangers and clover leafing can build density, naturally boosting crew performance, fleet utilization, and profitability. That can mean a lower price, seller holdback, transition help, or a longer training period.
This also changes how you think about location. Some buyers chase the building first. But depot location is only valuable if it supports the route. That’s especially true when a listing bundles the company with Commercial Real Estate for sale. If the property sits far from the strongest customers, it may be a real estate play, not an operating advantage.
Financing can shift too. A business-only purchase may fit one path. A deal with owner-occupied CRE may fit another. If you’re weighing both the company and the property, this guide on SBA 7a vs 504 for business and real estate helps frame the difference.
Y’all, this is the heart of it. You’re not only buying accounts. You’re buying the space between them. Price that space honestly.
Frequently Asked Questions
What is route density, and why does it matter more than total revenue?
Route density measures how closely customers are packed geographically and how much revenue a team generates between stops. It matters because scattered routes burn fuel, labor, and time, leaking margins even on solid sales numbers. Two $1M businesses can look identical on paper but feel worlds apart in daily operations.
How do I start measuring route density for a business I’m considering?
Ask for 12 months of completed jobs by address, ZIP, or coordinates, then plot them on Google My Maps or route software. Look for tight clusters around logical zones like Savannah-Pooler or Hilton Head, not confetti pockets. Factor in local friction like bridge traffic or Atlanta congestion to see the real picture.
What are the most telling metrics for route density?
Track stops per mile, revenue per mile, drive time as a share of paid time, and customers per route day. Low stops per mile or high drive time signals inefficiency, while strong revenue per stop justifies wider territories. Compare best and worst days to avoid averages hiding weekly messes.
How does route density differ across Georgia and South Carolina markets?
Savannah and Pooler reward neighborhood clustering and HOA work, while Atlanta packs density but fights traffic timing. Hilton Head supports premium pricing but adds bridge and seasonal hurdles; smaller areas like Macon or Waycross demand ultra-tight repeats to offset travel. Always test patterns against local logistics.
How should route density shape my purchase price and terms?
Dense, repeatable routes are premium assets – pay full value for smooth profitability. Thin routes mean negotiate lower price, seller holdback, or transition help to fix them via marketing. Use it to evaluate bundled real estate too: does the shop shorten dispatch or just add overhead?
Conclusion
A route business isn’t valuable because it covers a big map. It’s valuable when the work sits close enough to run clean, profitable days. That’s the real power of route density.
High route density also drives results like improved customer satisfaction from more reliable service schedules. Before you buy in Savannah, Atlanta, Hilton Head, Macon, Brunswick, Pooler, Dublin, Waycross, or the Warner Robins market, map the jobs, measure the time, and test the pattern. The cleaner the route, the clearer the deal.
We are Members of the Georgia Association of Business Brokers and Realtors, Commercial Alliance, Georgia Association of Realtors, and National Association of Realtors